An exmple of report given to a spa. The goal was to analyse a sample of transactional data and derive actionable insight from the 4 months customer data. The code is accessible here
About The Project
A spa in Reykjavík needed to get an overview of its customer data. It needed to better understand who was its customer base and how business was conducted. This is an extract of the visualisations and buisness reccomendantions handed over.
Aims and goal
This report aims to analyse transactional data and provide insights intot he customer dataset and their behaviour. It aims to to answer the following questions.
- How can the customer be segmented?
- Are there any feature to mark potential good customers?
- What are the buying patterns?
- …
Summary:
- Representation of Segments:
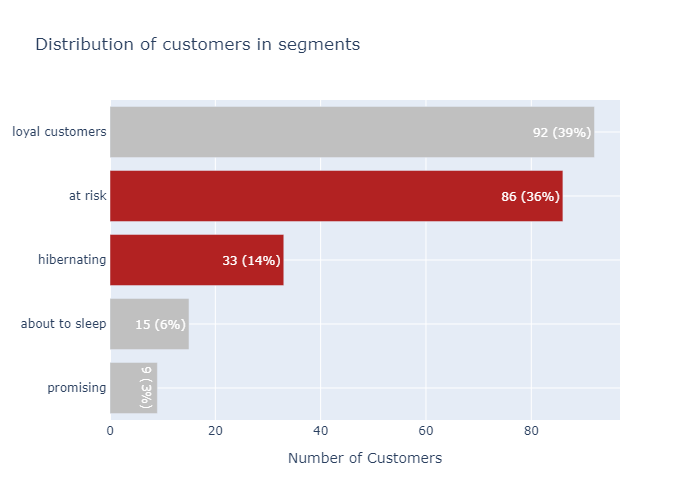
- Using an RFM matrix, the segmentation shows that about 40% of the customer are loyal. However, 50% are at sleeping and gone off.
- It seems to suggest that there are two main groups.
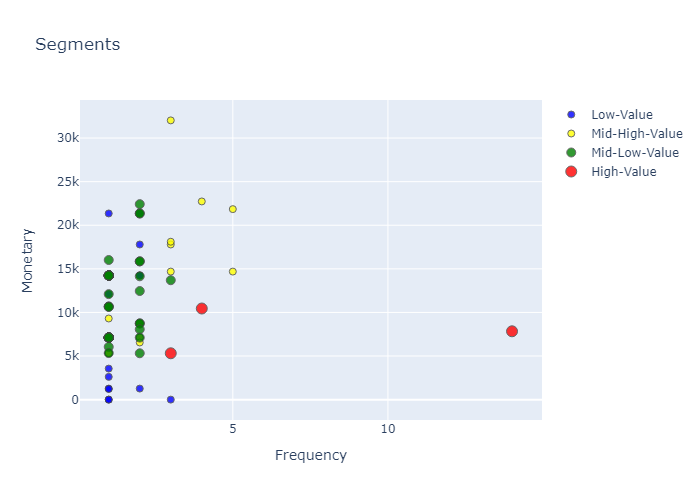
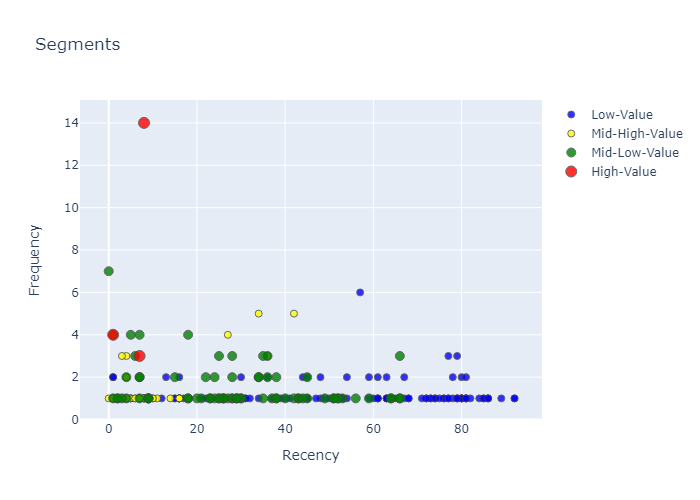
- A view of the RFM arguments shows that
- The majority of visits have less than 5 Frequency
- The visits seem to “burn” quickly, one or two visits and gone. There is a high churn rate.
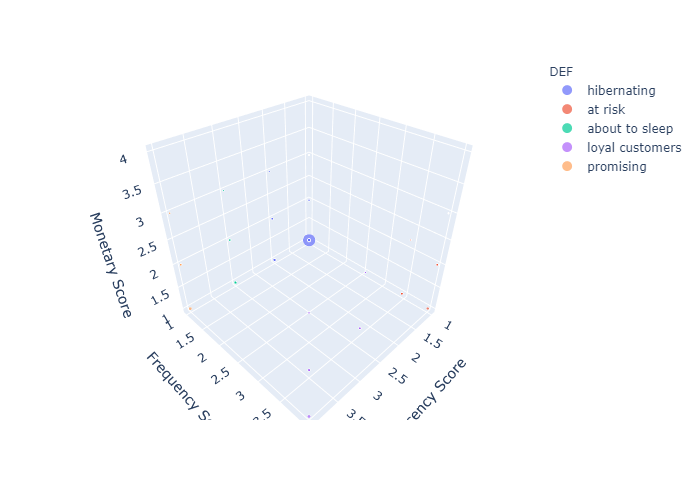
There really seems two groups, a large one that comes and go and a smaller one that seems to sticking and keeps visiting. One can visualise this in a 3d representations where
the two groups are clearly at the opposite of the spectrum. The value of each segement is not clearly visible.
- Modifying the first chart with the average monetary value you gets this treemap. One can see the decrease of average value to more loyal a customer becomes.

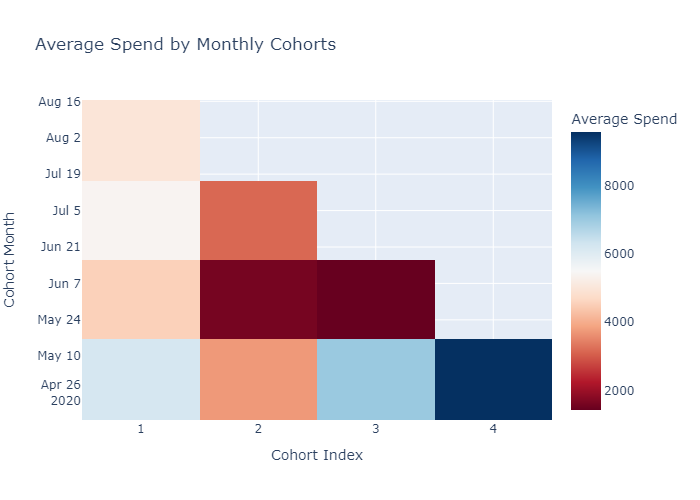
churn rate
On categorising the customer data set into monthly cohort of acquisition, it becomes evident taht the churn rate is big, with a monthly retention rate of les than 10%. Moreover,
it also becomes evident that overtime, the average monthly is decreasing.


FINDINGS AND NEXT STEPS
Over the course of this project, it becomes clear that two elements are at play.
- An unability to retain customers
- A high cost of retention of current customer.
The fact that customer comes once and dont come back can’t be figured with the dataset. One should look into extra materials and think in matter of product adjustemnt,marketing stratgies or branding. In order to verify the second point, a sales analysis to verify whether champions are given prefenrtial prices, either manually or via coupons should be done.
Roadmap
- Coupons analyse
See the open issues for a full list of proposed features (and known issues).