
The project was made for an essay of the University of Cumbria in the context of Msc in Data Analytics. It reviews the concepts of data science and analytics, then analyses an online luxury fashion C2C company’s dataset using Python, identifying weak correlations between social features/passRate and user sales.
About The Project
The paper gives a literature review of the terms data science and data analytics. A dataset of an online luxury fashion C2C company is presented and analysed in Python. Users of the dataset are segmented in various clusters and basic statistical exploration are done. Findings show that the social features and the passRate are weakly corelated to higher user’s sales. The findings are presented to the marketing team with suggestions to further actions. These include a focus on the education of key clusters and to increase the number of active users.
A BIT OF CONTEXT
For this analysis, a dataset provided by Jeffrey Mvutu Mabilama will be used. The data collected here represents selected metrics from a customer to customer (C2C) luxury fashion company, vestiairecollective.com.
As part of the sales process, the company has set up an authentication and quality control process where items are checked before they are sent to the customer. The item is directed to the company’s team of expert who asses the authenticity and the quality of the item before sending it to the buyer. The website provides social network features where users can follow a user, like an item or wish a product.
DEFINING A C2C PROBLEM
Research shows that customer engagement generates trust towards the brand and improvesthe intention to buy (Badenes-Rocha, Ruiz-Mafé and Bigné, 2019; Dolan et al., 2019). As the website is a C2C platform, its business model is based on the fees generated by each sold product. As shown in table 1, the current authentication fees are 5.49USD for items valued up to 275 USD, 2% for a value between 275-570 USD and 10.99 USD for values above 570 USD.
To generate money, the company needs to increase the number of transactions between users. However, the sale of one item above 570 USD generates twice the amount that the cheapest unit will. In this context, it is necessary to understand whether users involved with the website’s social features sell more items or if the item quality is a more critical factor. Therefore, it would be great to understand if and how users using the social features are selling more and how these features could be used to segment the users and organise marketing campaigns on the various segments. Questions that arise are:
- How do the current social features perform in this transaction model?
- How could the number of transactions be raised by increasing the number of successful sellers or pushing forward super sellers?
Summary: Analysis of an E-commerce Dataset
Representation of Segments:
- Active users: 21,639 (22% of dataset).
- Social users: 18% of global users.
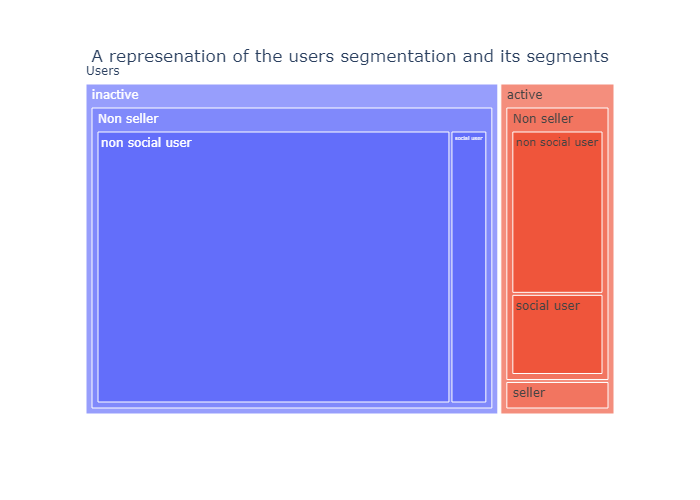
- Majority of users are non-active/non-social.
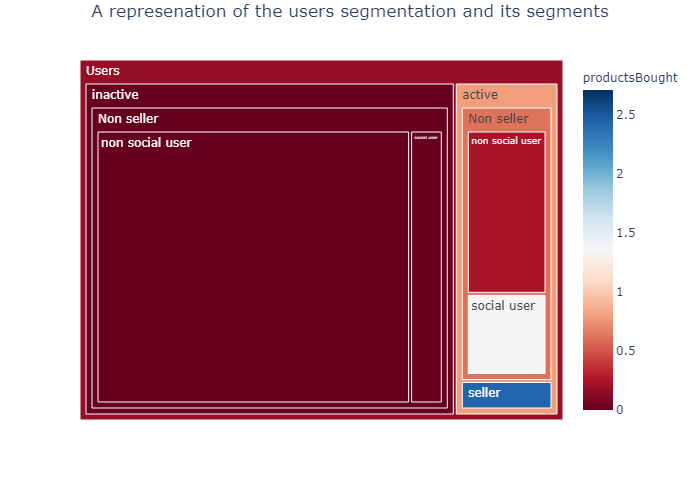
- Only 5% of users have bought at least one item.
- Buyers primarily belong to active/social user groups.
Early Explanations:
- Incentives to create accounts may inflate inactive user count.
- Buying pattern doesn’t strictly follow Zipf law.
- Limited correlation between social features and buying/selling.
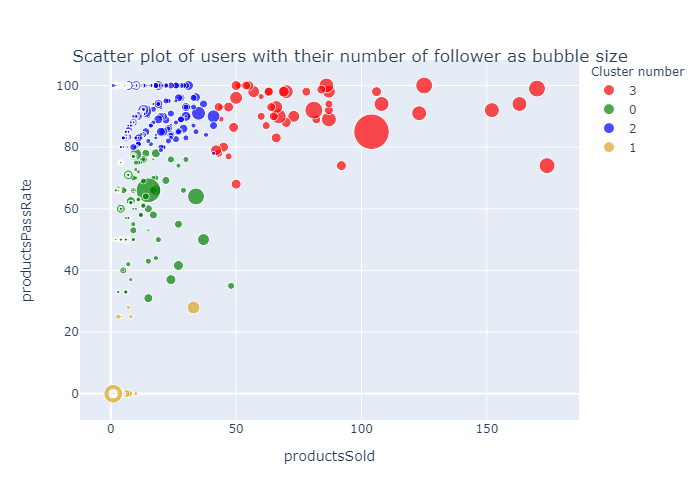
Deeper Analysis:
- K-means clustering reveals distinct seller segments.
- Cluster 3 represents top-performing sellers.
Findings and Next Steps:
- Higher followers correlate weakly with more sales.
- Only active users make purchases.
- PassRate percentage influences sales.
- Potential for growth across seller clusters.
FINDINGS AND NEXT STEPS
The hypothesises stated above is partially correct. The best performing cluster, cluster 3, with 49 users of 2036 successful sellers, represents 2.5% of the users, while this amounts to 31% of all sales. Simultaneously, the worst-performing cluster, cluster 1, represents 1109 users out of 2036, which amount to 56% of the successful sellers. The same cluster also amounts to 10% of the sales volume. When added up, clusters 0 and 1 amounts to 1360 users, cluster 2, 627 and cluster 3, 49. Respectively 66%, 30% and 4%. This is almost a match to Zipfs law.
- An email campaign could be set up for cluster 2 to teach them about proper brand building to increase the number of sales.
- An education campaign teaching what is a luxury piece of clothing, answering to the company’s quality standards, could lead to more sales.
Roadmap
- Analyse User retention
- Integrate with tableau/BI
See the open issues for a full list of proposed features (and known issues).